Winhttp Tracing Options for Troubleshooting with Application Request Routing
In my earlier blog “ 502.3 Bad Gateway “The operation timed out” with IIS Application Request Routing(ARR) “ I referenced links for gathering Winhttp tracing for troubleshooting 502.3 issues.
Since there are multiple ways to gather this in the Windows 2008 and 2008R2 I thought this might be helpful to outline this for the different platforms and how to gather this for fellow ARR troubleshooters.
Windows 2008
1. Start the Tracing . From a command prompt run the following command:
netsh winhttp set tracing trace-file-prefix="C:\TEMP\WinHttpLog" level=verbose format=hex state=enabled max-trace-file-size=1048576000
2.Recycle the IIS Application Pool.
3. Reproduce the issue.
4. Stop the Tracing. From a command prompt run the following command:
netsh winhttp set tracing state=disabled
5. Review the trace with Notepad or any Text editor.
NOTE: The Identity of the IIS application pool will require write access to the log location c:\Temp in this example:
This type of tracing is process bitness specific, so if you are looking at a 32 bit process running from 64 bit OS, you need to use: c:\windows\syswow64\cmd.exe, rather than using the regular 64 bit cmd.exe (start a run a cmd.exe)
Windows 2008 R2
Method 1
This method will output the Winhttp API calls , but not raw data for network communication. From a command prompt run the following command:
1. Start the tracing
netsh winhttp set tracing trace-file-prefix="C:\Temp\Test3" level=verbose format=hex
netsh winhttp set tracing output=file max-trace-file-size=512000 state=enabled
2.Recycle the IIS Application Pool.
3. Reproduce the issue.
4. Stop the Tracing. From a command prompt run the following command:
netsh winhttp set tracing state=disabled
5. Review the trace with Notepad or any Text editor.
NOTE: The Identity of the IIS application pool will require write access to the log location c:\Temp in this example:
This type of tracing is process bitness specific, so if you are looking at a 32 bit process running from 64 bit OS, you need to use: c:\windows\syswow64\cmd.exe, rather than using the regular 64 bit cmd.exe (start a run a cmd.exe)
Method 2
To get the raw data communication at network layer and the Winhttp Api calls.
1. Start the tracing: From a command prompt run the following command:
netsh trace start scenario=InternetClient capture=yes report=yes
Note the etl file location for example:
Trace File: C:\Users\<your user name>\AppData\Local\Temp\NetTraces\NetTrace.etl
2.Recycle the IIS Application Pool.
3. Reproduce the issue.
4. Stop the tracing: From a command prompt run the following command:
netsh trace stop
5. Read the Trace by opening it in Netmon 3.4.
Method 3
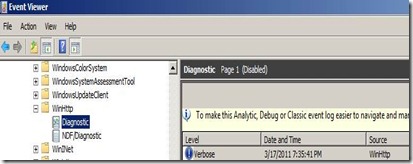
The ETW format for winhttp API is available on windows 2008 R2 and win7 via the Event Viewer
1. Open event viewer. Go to “View” menu --> make sure “Show Analytic and debug logs” is checked.
2. Open “Applications and Services logs” -- > Open “Microsoft” -- > Open “Windows –> Winhttp –> Diagnostic.
3. Highlight “Diagnostic” under Winhttp tree and right click mouse, then click “enable log”.
4. Reproduce the issue then you can review the logs.
References
Netsh Commands for Network Trace in Windows Server 2008 R2 and Windows 7
http://technet.microsoft.com/en-us/library/dd878517(v=WS.10).aspx
